


TECH ENGINE MB DYNOGRAPHS
I don’t think graphs on forums and magazine articles have been explained very well and there is a massive misconception to a graph and how that engine will work by seeing a graph. And there is so much bullshit out there to how fast engines go on the dyno!
We over geared a stage 4 200 once, and ran out of gearing and we got 126mph…….. yeah right!
So I will try to explain very simply how an engine will work based on looking at a graph.
You will find lots of graphs posted from different people using different dyno’s and there will always be a debate on who’s dyno reads correctly, who’s reads high and who’s reads low! To be honest I’m not into who’s got the lowest reading dyno which must give the highest powered bikes!
I know you can smudge a graph to make it look really great who’s ever dyno we are talking about. Personally I work through a pre warm up setting up procedure which I have spent many hours perfecting, SO most of my graphs can be a very accurate comparison between one engine and another.
It’s very easy to sit a bike on a dyno, run it up and take a reading, do it 20 times and things will change through heat for instance. Tyres and tyre pressures and sitting on the makes massive differences! Our basic procedure warms up the engine, right back to the hub and tyre, set with a digital thermometer, then we always do runs setting off from the same rev range. And when theres 2 – 3 dyno runs where the graph exactly over lays each other you have an engine set. Do this a year later and it’s as good as you’re going to get.
What can you see in a graph? Well what goes up must come down, its a fact of life. Ok its not an apple, it’s a bit different but it’s a basic. An engine will have to start from no revs at some point, that will be with the engine turned off. Start the engine and it should tickover from say 800-1500rpm. An engine has no power here so as you open the throttle and the revs will increase to it’s peak power, keep revving and eventually that engine will run out of steam and will slow down on the revs.
Not every engine is the same, depending on how the engine works it may have:
- Bottom end power
- Mid range power
- or top end power
or
- Bottom and mid range power
- Mid range to top end power
Ideally a good engine has all three joined together, which is quite hard to get. So what’s best? Well this will depend on what you want from the engine.
- How fast do you really want to go?
- Do you ride two up? And what is the rider, passenger and luggage weight?
- What speed do you want to drive at?
We set our engines to give what the customer wants and what is practical. In the early days customers asked for engines to do 100mph but never went above 70mph? So I learn’t very early on to tweak an engines tune, gearing, carb and exhaust system to suit the customer.
GRAPH EXPLANATION
Go back to school, a graph is a graph, you have two scales, these can vary in size from dyno to dyno and the power perimeters involved.
So here goes:
- Left hand vertical scale = bhp (brake horse power) shown on this scale as 3 to 27
- Lower horizontal scale = rev range, from 3’000 to 8’500rpm
- Red line is brake horse power (bhp) the rev’s power line
- Green line is torque, the very important line showing real power
- The other information is details on the run, with notes on name, engine, exhaust used
On MB’s Dyno which is a Hyper dyno same as Readspeeds and PSN’s a second over graph comparison run shows as a Black dotted line which is a second bikes bhp and a light green dotted line is it’s torque.
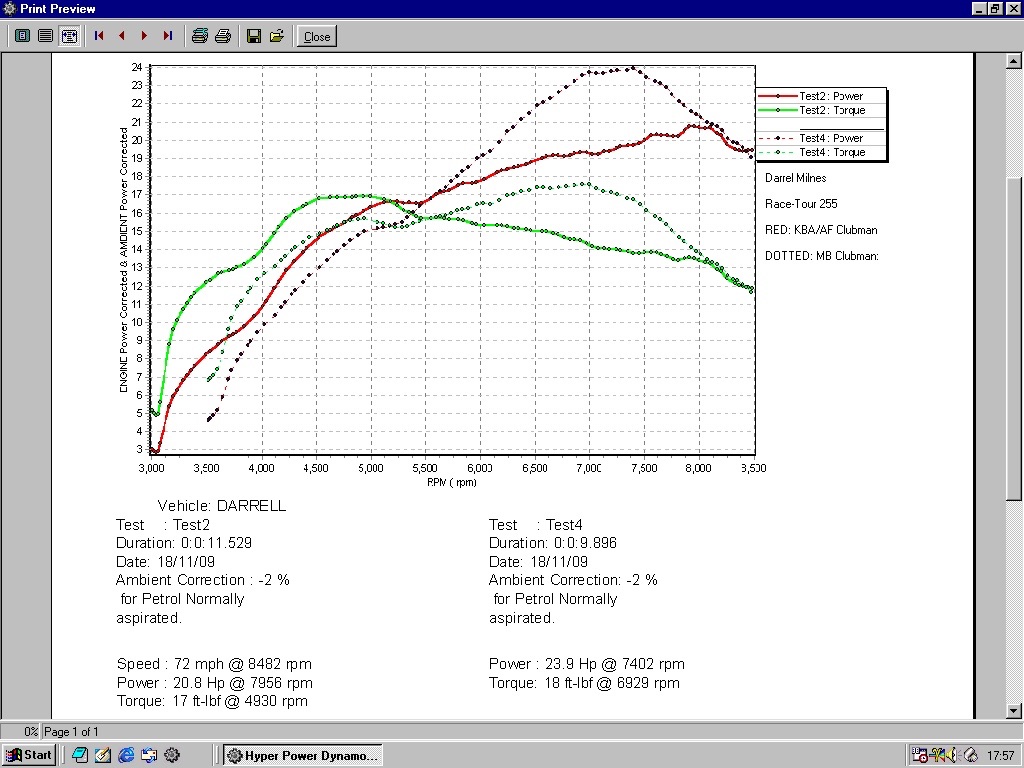
This test shows the same engine with 2 different exhausts to compare. The Hyper soft ware is not very good as it uses dotted lines. where as other dynos show coloured lines.
Bhp scale is 3 – 24bhp, rev range is 3’000 – 8’500rpm.
High dotted line in Black is a one off MB Clubman bhp, lower Green dotted line is torque.
Red line is AF KBA Clubman bhp, Green line is KBA torque.
You can see the KBA does reach peak bhp as much as the MB pipe does, peak MB 24bhp, peak KBA 21bhp!
This also shows in torque, MB peak torque is 17.5 KBA 17, okay very similar but the KBA peaks at 4500-5000rpm and starts to drop, where as the MB peaks higher at 7000rpm. If you read the power on torque only the KBA is the best pipe for a city or slower rider where as the MB is more suited on the open road and produces a faster bike
To explain how to do a dyno run, once the engine is pre-warmed and the computer is set up at a given rev range which we can adjust (here set at 3000rpm) we wind on the engine and run it flat out to another given point. This given point is based on the tune/power and what the exhaust will let it rev to. If you are not sure as part of the warming up procedure you can start at 3000rpm to say 6000rpm, if the bhp graph is still climbing try 3 – 6500, then 3 – 7000, then 3 – 7500, then 3 – 8000 until you start to see the power drop.
- Look at graph below, Red line starts at 3000rpm, climbs nicely up to peak power point (G) 6600rpm then drops down all the way to 9000rpm. Look at its corresponding torque line, Green, from 3500rpm it has a nice high flat spread up to its peak torque of 13.8 point (F) and steadily drops away to 9000rpm
- Look at the Black dotted line, 7250rpm area, then it falls away and goes flat to 8000rpm then drops to 9000rpm. The Green torque line follows the main graph to point (D) 4800rpm area then drops very quickly down to 9000rpm.
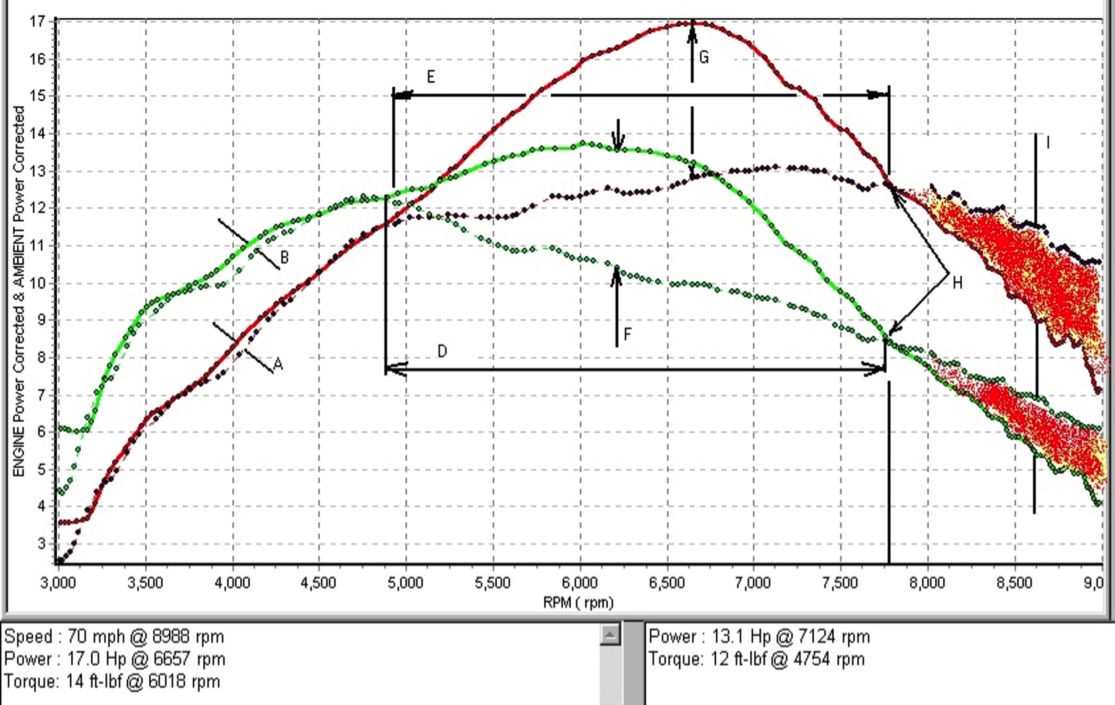
So whats happening? The higher the peak bhp and torque the better the engine will be, the wider the spread of these figures the better the engine will be again.
Graph line in Red is a better engine than graph dotted Black, all that’s changed is the exhaust, so this is dyno graph comparison between a one off MB Clubman and a commonly used KBA or AF type Clubman. But why does it show that one is a better exhaust over the other?
I will explain a little more, both exhausts start off quite equal up to 4800rpm, there is a slight difference at point (A) and (B), this is so small you would not feel it on the road it could just be the way the operator winds on the throttle showing this so ignore it, call them equal to this point.
This is where one exhaust takes over the other, look at between the 2 points of line (E), 4800-7700rpm the Red line carries on climbing to peak at (G) 17bhp at 6600rpm but the Black line just tries to slowly climb to its peak at 7100rpm 13bhp, then they meet at point (H) 7700rpm.
Follow the torque lines again they start out the same to point (D) 4800rpm, then the dotted graph drops straight away in nearly a straight line to 9000rpm where as Red line keeps climbing to point (F) 6200rpm then it drops away and eventually meets at point (D) 7700rpm. The difference in horse power between points (G) is a massive 5bhp! The difference between the torque is 3hp which is also massive at 6650rpm.
The filled in Red area (I) is the absolute over rev, beyond red lining a motor, its totally a waste of time reading anything in this area as no engine will perform in these areas and the power has dropped away so much.
Why is the Red graph the best, well lets take a Lambretta engine, this one for example is nothing super special its just an MB Race-Tour kit off the shelf. But what it’s showing is the motor has a power spread between lines (D and E, 4800 to 7800rpm) and because we are talking about Clubmans we could say the power spread comes in even earlier because the torque figures are so high 9hp at 3500rpm! As a comparison a standard GP200 only had a PEAK bhp figure of 9-10bhp at 6500rpm, showing this motor to be very good.
But in the real world what will the motor work like?
The MB Clubman will pull like a train from nothing, 3500rpm to around 7000-7500rpm. How do I know? Obviously I have ridden and tested many engines, the torque graph is very high and has a wide spread, the Red line is smooth from nothing all the way to a high peak then tails away! The REAL point of any engine to find its limit is usually after peak and will rev on to around 500 – 1000rpm more, to around 7500 – 7700rpm. This is based on a rider sat up, in good conditions, with correct gearing and the engine set up correctly, GPS speed not Lambrettas 85mph speedo’s. Ok it may over rev in say 1st or 2nd as the gearing is easier and it may over rev down a hill or slip streaming. But in the normal real world this engine will be limited to around 7500 – 7700rpm. These are based on power to weight ratio, power of engine and physical size of a Lambretta pushing through the air. Because of this power spread, you could say it is a bottom to mid range motor, but as it has a good mid to top end peak both in torque and revs it is a good top end motor that could pull higher gearing, increasing the speed without needing to rev high or thrashed it! It will make a nice drive-able ride-able motor.
Look at the KBA Clubman, torque and bhp starts nicely to 5000rpm then the revs go flat but more importantly the torque drops so quickly! What we are seeing here is the revs carry on but the torque drops which means the engine works well around 3500 – 5500rpm, which is setting off and pottering around town and lower cruising speeds. Then you will find after 5500rpm the engine doesn’t pull, but it will rev given the chance, one of those engines that will rev and rev if you hold it flat out.
The difference between the two put head to head will be; they will set off the same to 5000rpm then the MB Clubman will carry on at the same rate of acceleration where the KBA will slow down and will drop back. If you change gear on the Red line graph at around 7000rpm the drop in gear ratio (lets say roughly 2000rpm) is perfectly in its power band and will accelerate and carry on into the next gear. Compare this to KBA, change gear at 7000rpm with a drop of 2000rpm through the gear change and it will land on the start of the down side of the torque graph. You could ague but the KBA is still revving on to say 7800rpm, change gear then and the torque is really on the down ward side and just becomes a flat, revvy gutless bike, that will not work over geared or two up at higher speeds, where as the MB one will. But we all know a KBA/AF Clubman is not a bad pipe, what it shows is there is some thing out there much better.
Given we usually use something like 1:1 gearing, like an Sx200 4th gear ratio which gives 10mph per 1000rpm. It will show on the graph 500 – 1000rpm after peak bhp, in 4th gear, a top speed of roughly 71 – 74mph (give or take a little). This does work, I proved it at 10’000rpm at 108.5mph once with a police camera.
All our dyno runs are done in 3rd gear as with all engines we test, so the graph shows top speed at 8988rpm giving 70mph!
Why does a graph show this when I’ve said it will not do it on the road? Well the dyno turns a roller, which doesn’t allow for wind and weight extra. Most Scooter dynos are this type called the inertia type. There are others with a loading cell which replicate wind and road conditions, these are to be preferred as you can get real heat into the engine like you would see on the road. Saying that you can do some good development work on a standard inertia dynos.
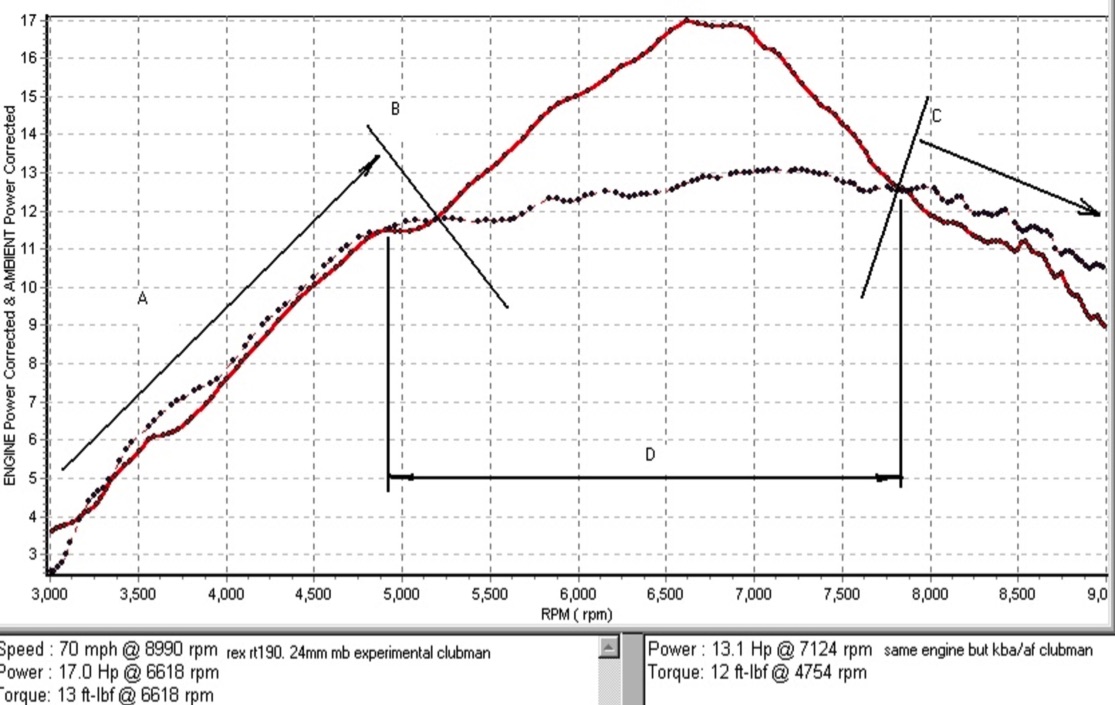
Below graph shows the same engine but horse power only.
- Line A on acceleration can be said to be the same on both Clubmans to point B
- Line D could be expressed as the power spread
- Line C to 9000rpm can be classed as a total waste of time, we could have re-altered the cut off range on revs to 8000rpm, but we test most road engines to 9000rpm so all are comparable.

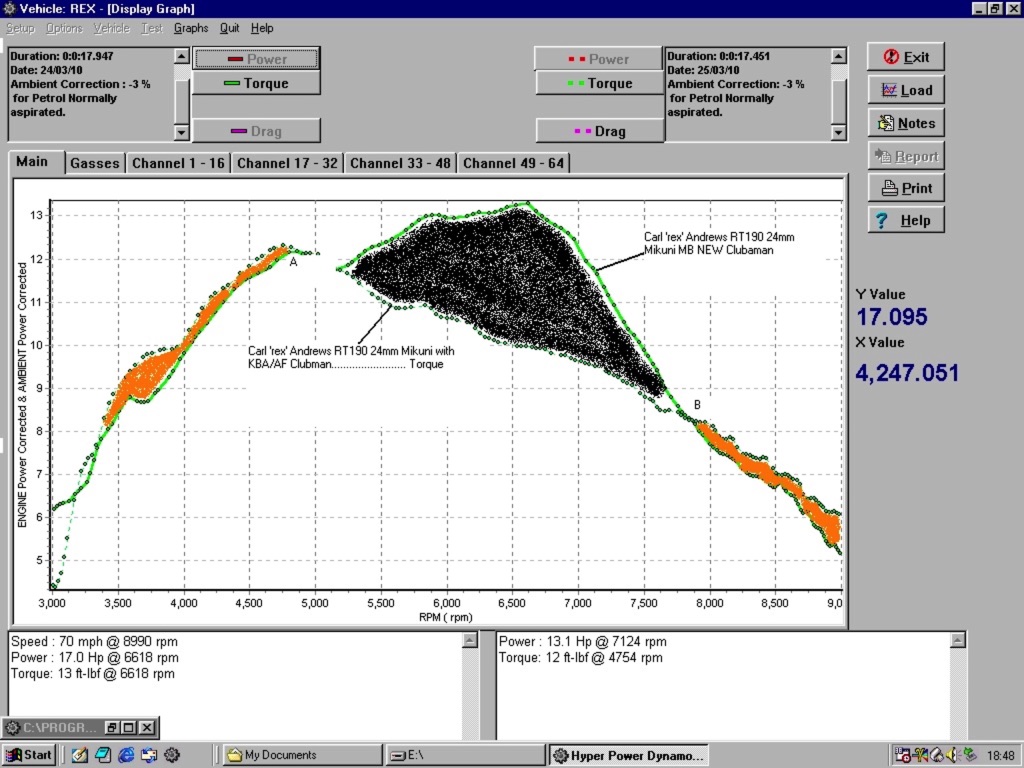
Below graph shows a different engine but this is torque only.
- Look at the areas filled in orange, these are the areas on this engine where the KBA/AF Clubman is slightly better, low down from 3000rpm, yes it better but only a little better, it is so small it’s not considered an improvement, on the upper rev range I’ve already said waste of time.
- Look at the black shaded area, between A and B this is the main improvement area and just in the middle of the rev range where a Lambretta needs it between 5000 – 7500rpm which equals roughly to 50 – 75mph. But don’t forget the Green line has power from 3500 – 7500rpm in torque making for a very good engine with a 4500rpm power spread!

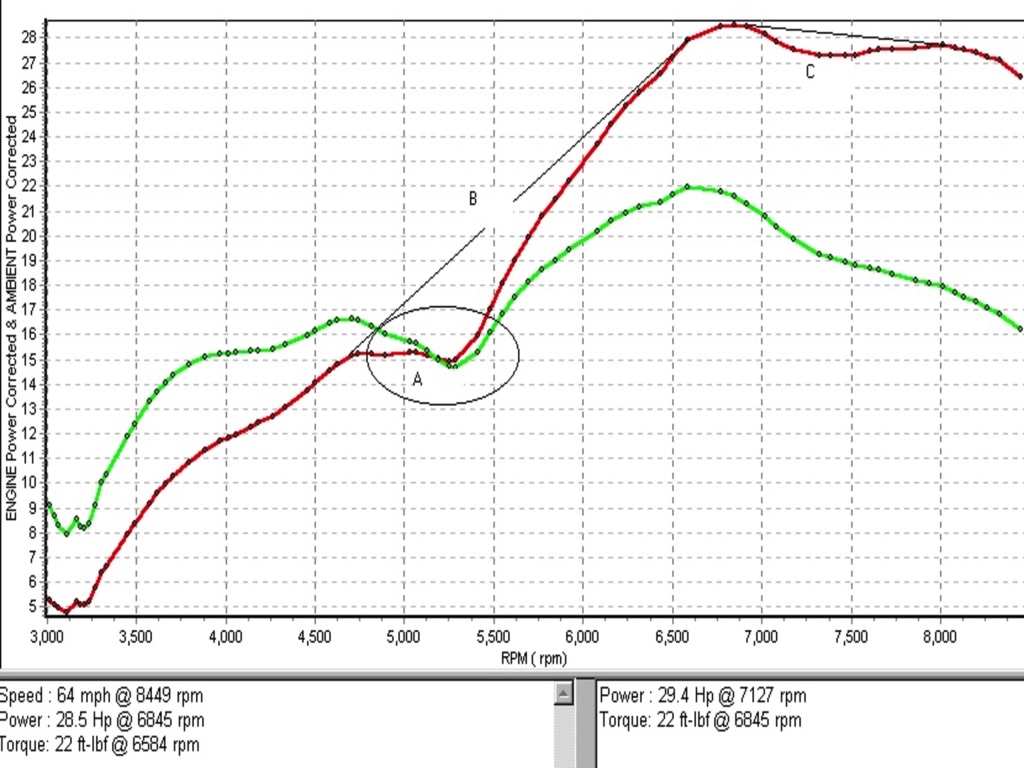
Below is a totally different graph to give an idea of a different engine. This is a TS1 using a racey JL pipe. You can see the graph is not smooth from 3000rpm to its peak at 6845rpm. At point A area there is a drop in bhp and a big drop in torque.
Why? Well there’s a number of reasons, cylinder design, port timing over lap, exhaust design and jetting. This you can really feel on the road and is seen on lots of forum graphs. It doesn’t make for a good running engine, how many times have you read about a sputtery hard to jet engine in this area 4500 – 5500rpm! This is one and remember that it is at around 45 – 55mph, pottering around, cruising speed for some. But ride in the power band and change gear correctly this would be a quick engine, just crap around town out of the power band.
But…………. if you could join the upward graph from A through line B to peak you can see things would improve and it would look like our earlier RT graph. Look at area point C, there is a slight dip in in the red line, cured by raising the exhaust port a little and the graph would smooth out with a little loss at lower revs.
The new KyTronic with pre set ignition curves should improve this drop. Today MB have tweaked port timings and exhaust designs to get rid of this drop and it makes for a much better engine.

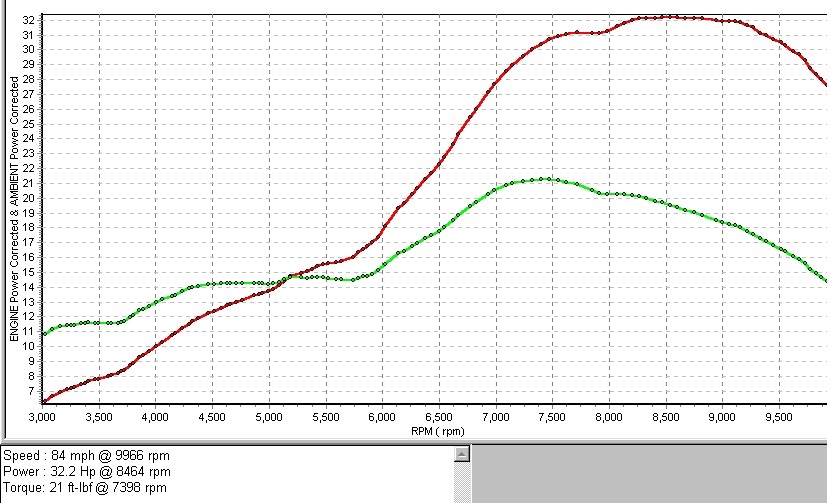
The below shows a beautiful graph and engine. It is one of our Race-Tour tuned TS1 engines, with a JL pipe, 35mm TMX, 60mm RT crank. Its smooth with a wide spread and with a good top end power spread. It peaks at 8500rpm revs on to beyond 9500rpm and has a power spread of around 3500rpm! With 21lbs torque!
A fast engine in and out of the power band. Peak cruising is at 7-8000rpm, remember if you used one to one gearing 70 – 80mph cruising top speed of near 100mph and this is a road tune!
NOTE no drop at the 4-5000rpm area, as other tuners always get!

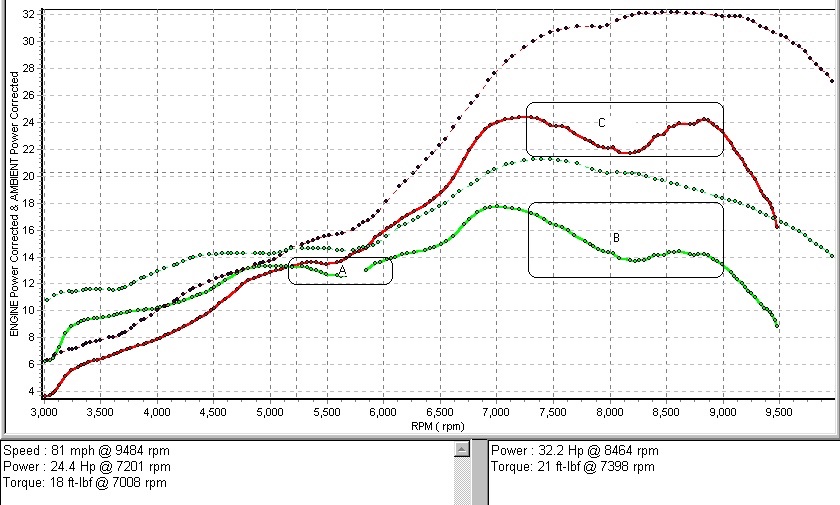
The below graph shows a comparison between the last MB RT TS1 graph and a Road/Race TS1 that Taffspeed did. Area A shows a big dip in torque and area B has a very big dip just where you need it for cruising, also shown in area C on the bhp graph. The customer complained standard TS1’s pulled away from him all the time and if he hit the wind it would go backwards.
Comparing it to our graph it is not so good and these used the same 70 x 60mm set up, same carb and similar exhaust……………………. And that is why we use dynos, to find out these problems.

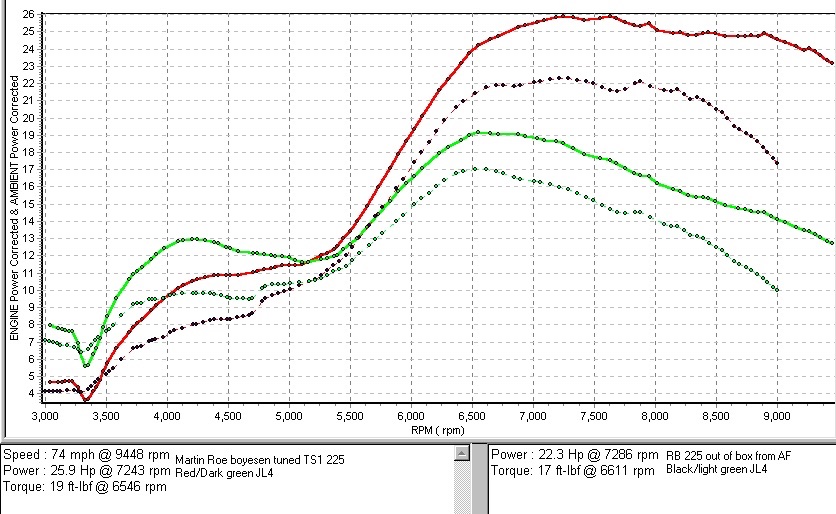
Below graph shows a comparison between two very similar but totally different engines.
The main graph RED bhp and DARK GREEN Torgue is from Martin Roes MB TS1 225 tuned with Boyesen inlet feeds as a direct comparison to a RB225 which also has Boyesens feeds direct from AF Rayspeed shown in dotted Black bhp and dotted light Green torque.
If you follow both bhp curves they are very similar so what makes them similar graphs?
Martin Roes TS1 is an MB Iron linered cylinder, it was done in the 90’s and was the first time Mark connected the inlet port to the transfer ports, called Boyesens ports. It also has an inlet feed into the casings and the transfers feeds are larger. The exhaust port is a standard single port type, it has 2 boost ports above the inlet and 4 transfer ports and was set for touring. It used a 30mm Dellorto and for this test we used a JL4 exhaust.
So to compare;
We took a RB225 cylinder kit, direct from Rayspeed and fitted it to a good running TS1 engine for testing. The RB kit is very similar in spec to the MB TS1 of Martin Roes, Boyesen ports, 2 boost ports, 4 transfer ports but the RB has an exhaust port with 2 auxiliary ports. Both use similar port timings, the MB uses a smaller transfer timing. This motor used a 35mm TMX and the same JL4 pipe.
But look at the MB TS1 it has more torque especially low down at 4200rpm making it very easy to ride around town and low speeds. The bhp is massive as well, it comes in before the RB, it has more bhp and carries on further! With a peak bhp of 25.9 it is over 3 bhp more across a wide rev range from 6500 – 9000rpm. The torque lines look very similar but the MB TS1 just has so much more over a RB.
- The graphs look similar in shape………. we used the same exhaust and usually the exhaust controls the graph!
- The TS1 trashes the RB……… Mark uses smaller port timings and a single exhaust port.
- The TS1 trashes the RB……… Mark uses a different design head, indeed a MB head fitted to the RB transforms the power and gained 3 bhp across the rev range!
- The TS1 uses a 30mm……….. proving you don’t need a 34 – 35mm carb to get a good high powered touring engine.
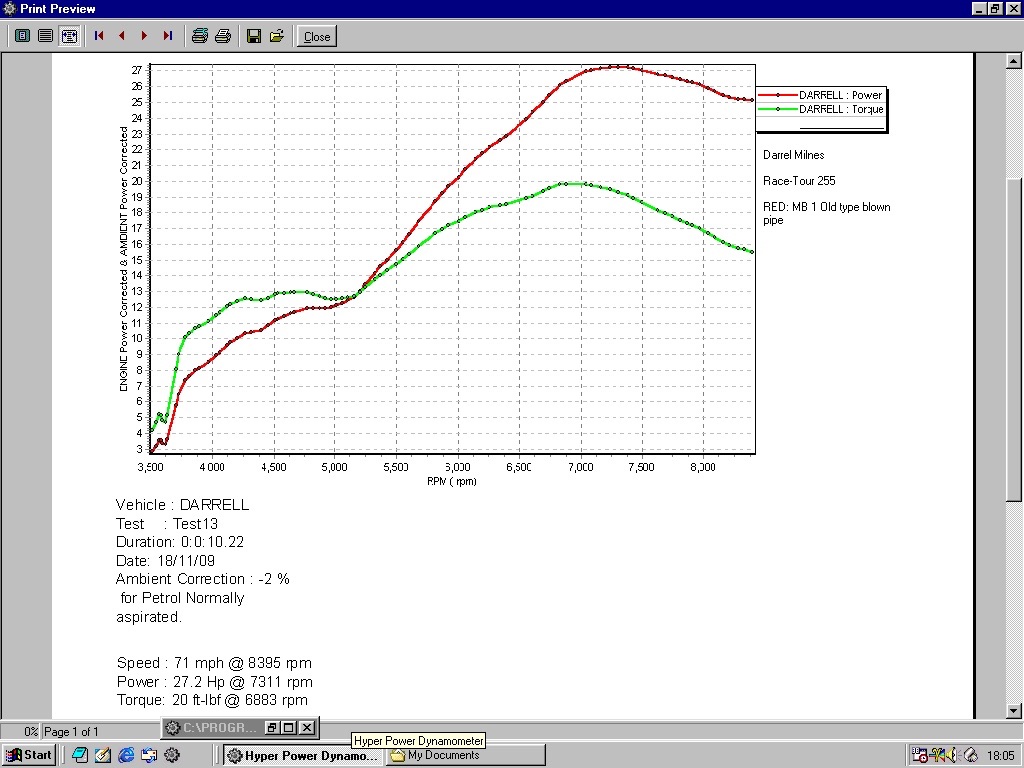
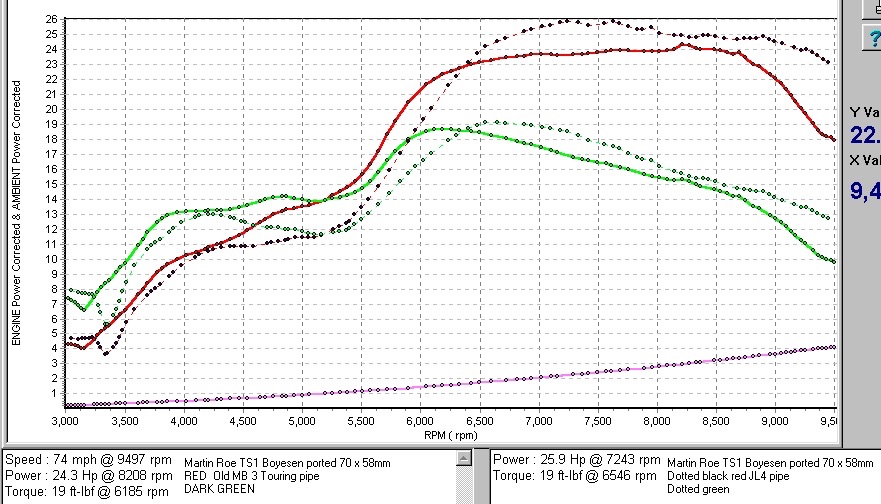
The graph below compares Martin Roes MB TS1 fitted with a MB3 old blown style touring pipe RED comparing to a JL4 race pipe dotted Black. Both pipes where produced way back in the early 90’s. They are totally different to look at, the MB3 is a long thin blown pipe designed on paper for touring. The JL4 is a fat segmented pipe aimed at racing and was developed from a TR750 Yamaha from the 70’s (if my memory serves me well) and designed by Taffspeed and the Taff race team. The graphs are quiet similar to look at on first inspection…………… BUT………….. this is where you should learn to read graphs.
Don’t just look at peak horse power and which revs the highest!
Look at the power spread of the MB 3 RED graph, it has a power spread of 3000rpm! Which is brilliant! The JL4 has a similar spread but higher up in the rev range, meaning it will be harder to ride. Look at the Torque of the MB3 it comes in higher at 3500 and has more torque all the way to 6500, meaning it will be easier to ride up to 60mph and will be quicker off the mark, then from 6500rpm both torque curves start to drop, but there is little in it. Also look at the massive dip in the JL4 torque from 4200 – 5500rpm you can really feel this dip when accelerating and riding hard through the gears.
Ok ridden flat out and in the right hands the JL4 will have the better top speed BUT its about getting a Lambretta off the mark and keeping it up there in the first place, the engine with MB3 will ride so much easier all through the rev range as it has more torque and revs lower down and very importantly it is a smoother graph with no torque dip!
This would be a genuine 90mph bike.
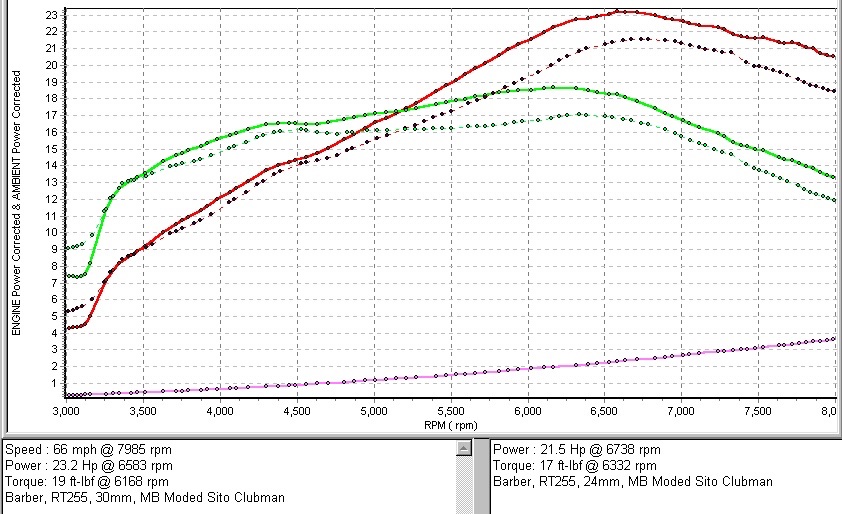
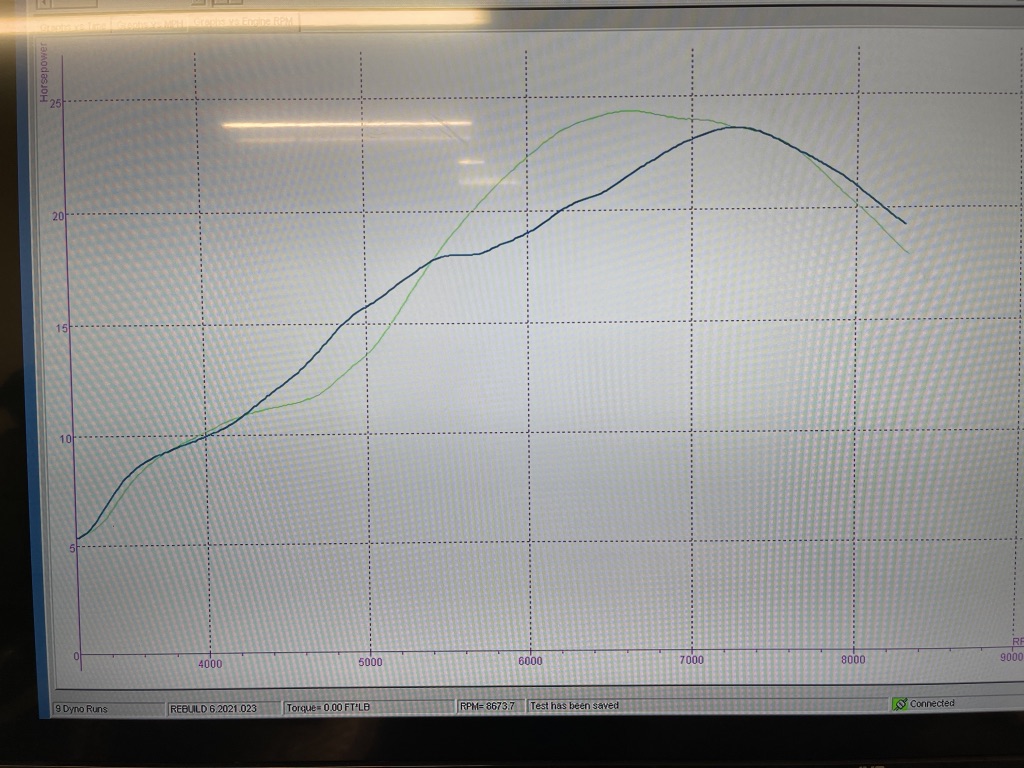
The below graph shows the difference between fitting a 30mm carb against a 24mm carb.
The engine is Paul Barber’s 255 Race-Tour cylinder. Which is piston ported running a 71mm piston and MB 64mm crankshaft.
Both graphs run the Sito Clubman supplied. This engine was designed for high touring speeds and big torque.
This compares a direct replacement of carbs. Paul wanted to use the 24mm TMX through the air filter box to keep it all standard looking, a perfect wolf in sheep’s clothing.
Not too impressed with the performance we swapped carbs to a 30mm and this is the difference. From 4000rpm it gains 1 bhp and increases to 3 bhp all the way to 8000rpm where we shut off the dyno but it was still revving on. Check out the wide high spread of torque 13Ibs torque at 3000rpm to peak at 17.5 and it still has 15 at 8000rpm!
And it pulls like a train! So we are told by Paul, he knows he’s a train driver by trade.
With a MBgm Clubman or an expansion chamber the power was much higher.

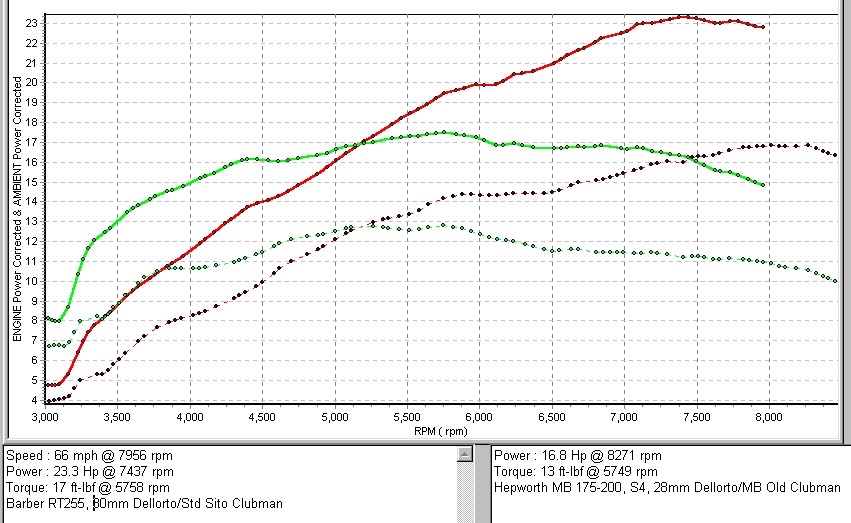
The photo below shows a comparison between two different engines.
The Red and green lines are Paul Barbers RT255 again with a 30mm and the Sito Clubman. The Black and light Green lines are Ian Hepworth’s MB 175 cast iron cylinder bored out to 200cc and Ceramic plated with a stage 4 tune, 58mm stroke crank, 30mm and an old MB Clubman from 2000.
The RT255 has a massive power spread…… why?
Well the only obvious differences are:
- The crankshafts strokes 64mm compared to 58mm
- The piston size 71mm to 66mm
- The difference in cc is 55cc
Both engines have the same carb, very similar exhausts as you can see by the graphs shapes. The Inlet, Transfer and Exhaust port timings are very similar, our MB Stage 4-5 touring porting specs!
The difference is massive!
But look at Ian’s motor, Ian is a big lad, like riding two up, he tells us, it also pulls like a train, from 30mph to flat out and pulls up hills and is really easy to ride!
Ok, its down on power to the RT255 but look at the peak revs, an MB Clubman wants to peak at 8000rpm giving a great top speed, the torque may be down but peaks at 13 and holds 11 at 8000rpm. Ian is very happy with the engine and says it does everything he has ever wanted from a Lambretta mild tuned engine, so just how happy would he be if he had Pauls RT255?
Below graph is shown in a different way. Some dynos you can colour the back ground and alter the graph line colours to help you read things better. This is on our Hyper dyno modified with different soft ware. And shows 4 runs on the same engine with 4 different pipes.
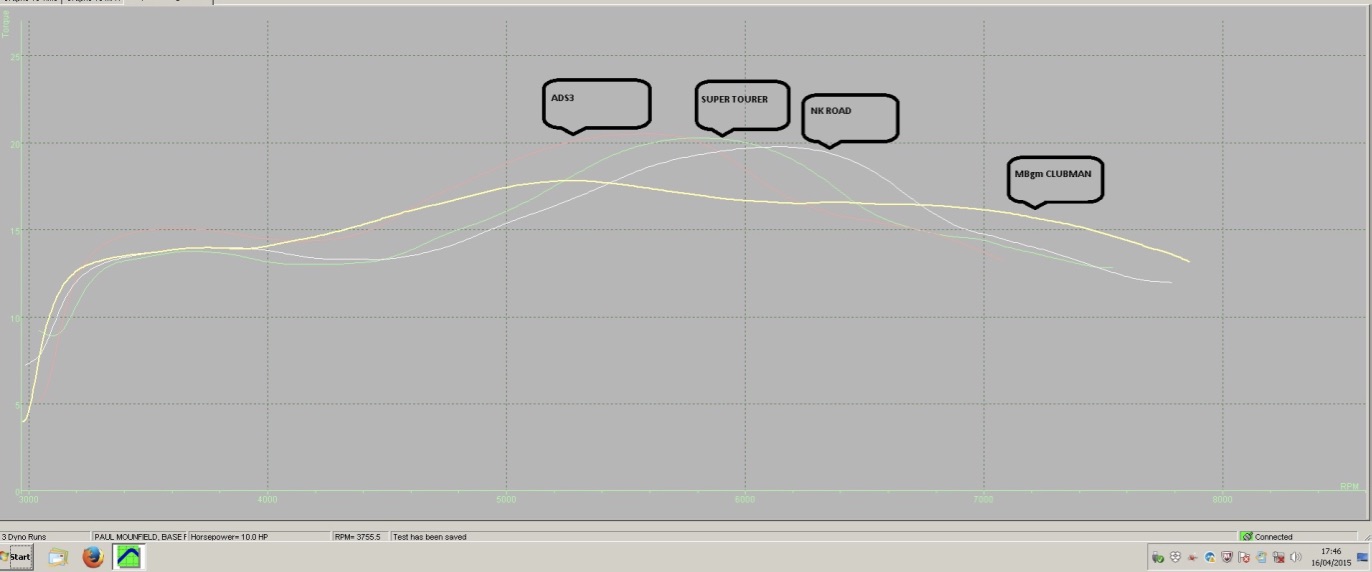
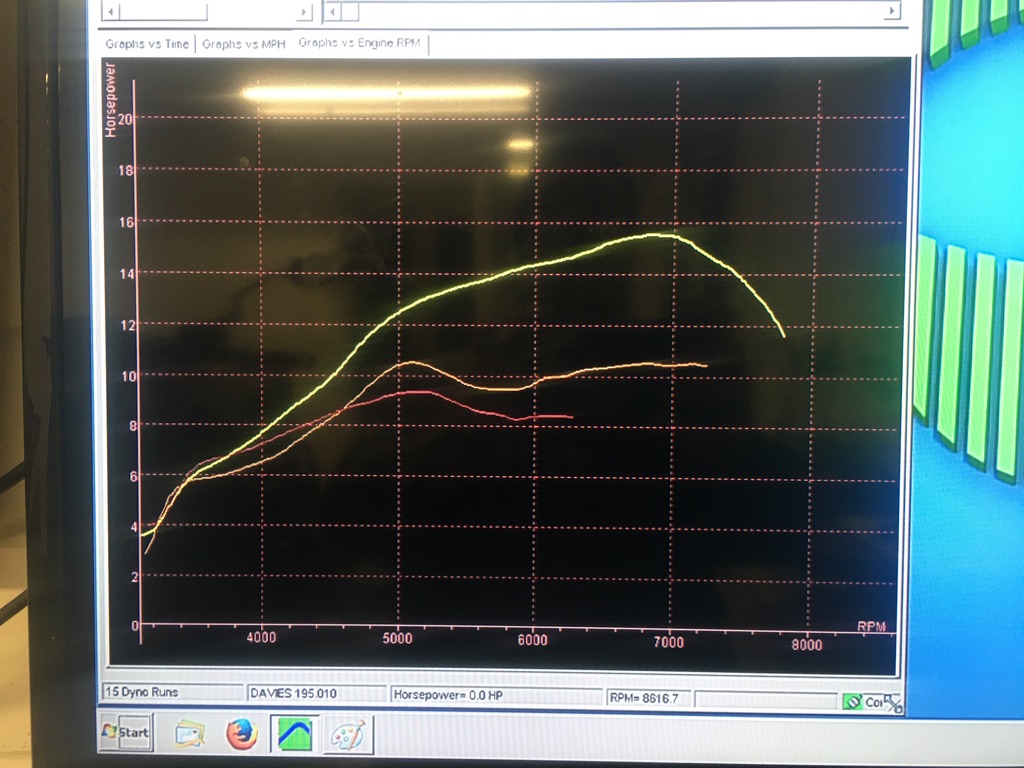
The below two graphs are the same runs but shown in a different way. Both set with a Black back ground. You can set Black, Grey or White it makes no difference.
The difference is in the top graph, which has had the graph on the computer screen spread wider. This tricks you to think the engine has a wider spread of power – it doesn’t!
Some operators think they are clever spreading the graph, all it does it gives a false reading.
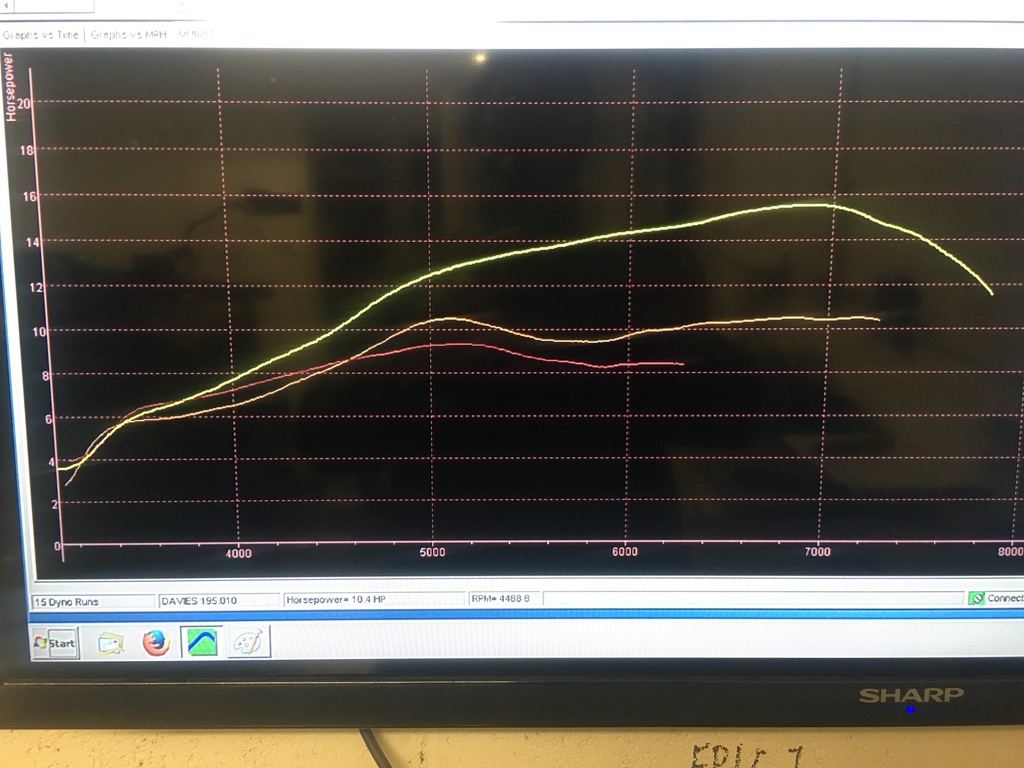
Below is the same graph but condensed, it shows more real world figures as you can see what you will feel on the road.
Below shows how we set out latest dyno with a simple easy to see and read White back ground with coloured lines showing two different horse power runs with two different exhausts.
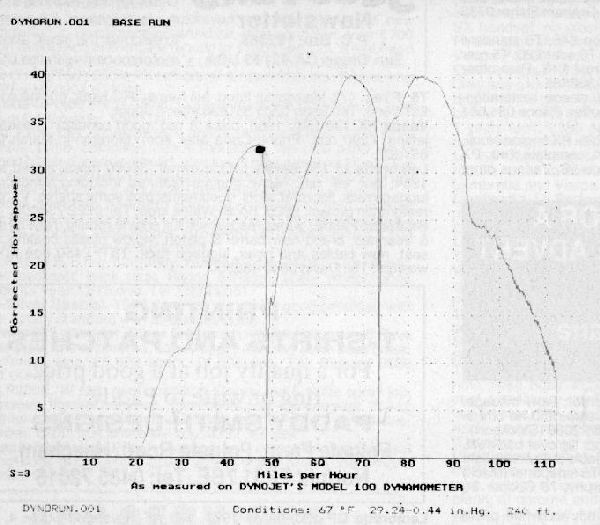
Below is another way to show a dyno reading. This was on an early Dynojet showing my 1990s sprinter going through 2nd, 3rd and 4th gears. Look in 3 – 4th gear it held 40bhp! In 2nd I changed gear before it hit peak power. A record set for many years! Note we over revved it to show over 110mph!
If you have a questions please Email mark@scooters.co.uk


